Visualise your energy management
In IngSoft InterWatt, different dashboard variants are available to you to quickly get an overview of your climate, environmental or energy management. Consumptions and other relevant key figures are visualized clearly and concisely. You customize your dashboard according to your requirements and wishes.
Dashboard configurations in IngSoft InterWatt
Standard dashboard
In our basic dashboard, the energy consumption of the last two months is displayed by default. A visually highlighted arrow graphic quickly shows whether energy consumption has decreased or increased.
Of course, you can customize the displayed evaluation period in the standard visulization and differentiate according to consumption, costs or emissions.


Free configuration
If your requirements go beyond the display options of our standard visualization, you can also put together your own dashboard completely individually. IngSoft InterWatt offers a wide range of design options for this. Particularly popular with our customers are, for example:
- Benchmark
- Measures tracking
- Target achievement
- Individually defined evaluations
The color display of the dashboard can be freely defined.
Geographical navigation
Does your company have a large number of locations? Then use the so-called "Geographical Navigation" as the start interface. It allows you to clearly display your organizational structure on a world map. This is helpful if the locations of your company are scattered globally or, for example, extend over a larger urban area. Thanks to the geographical overview, you can navigate quickly and conveniently between the created structural elements.
The display of the Geographical Navigation in IngSoft InterWatt is done through Google Maps integration. Therefore, you can access the entire map material available in Maps.

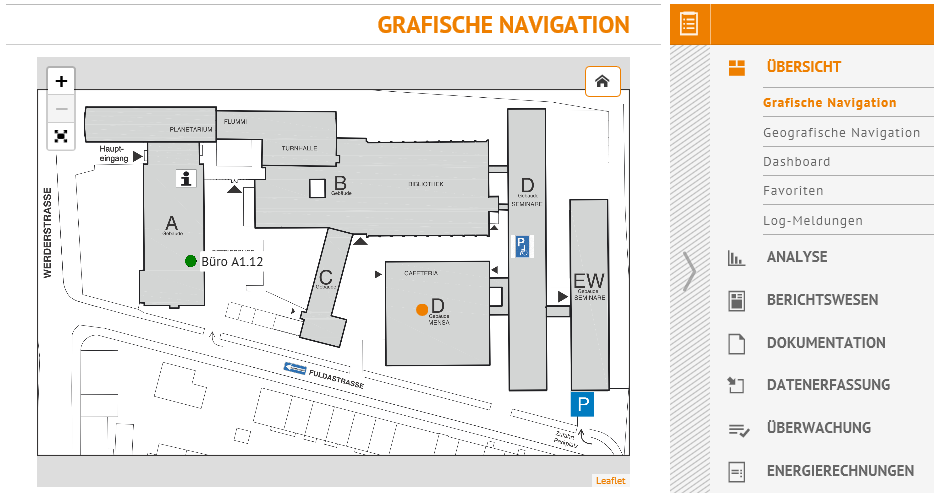
Graphical navigation
In IngSoft InterWatt you can also upload your own images (e.g. floor plans) and use them as a navigational start interface. By clicking on the predefined image components you will get to your respective structural elements.
The graphical navigation is often used for
- Plant buildings
- university campuses
- Hospital plans
- Office buildings