Transparency about consumption and costs in your company
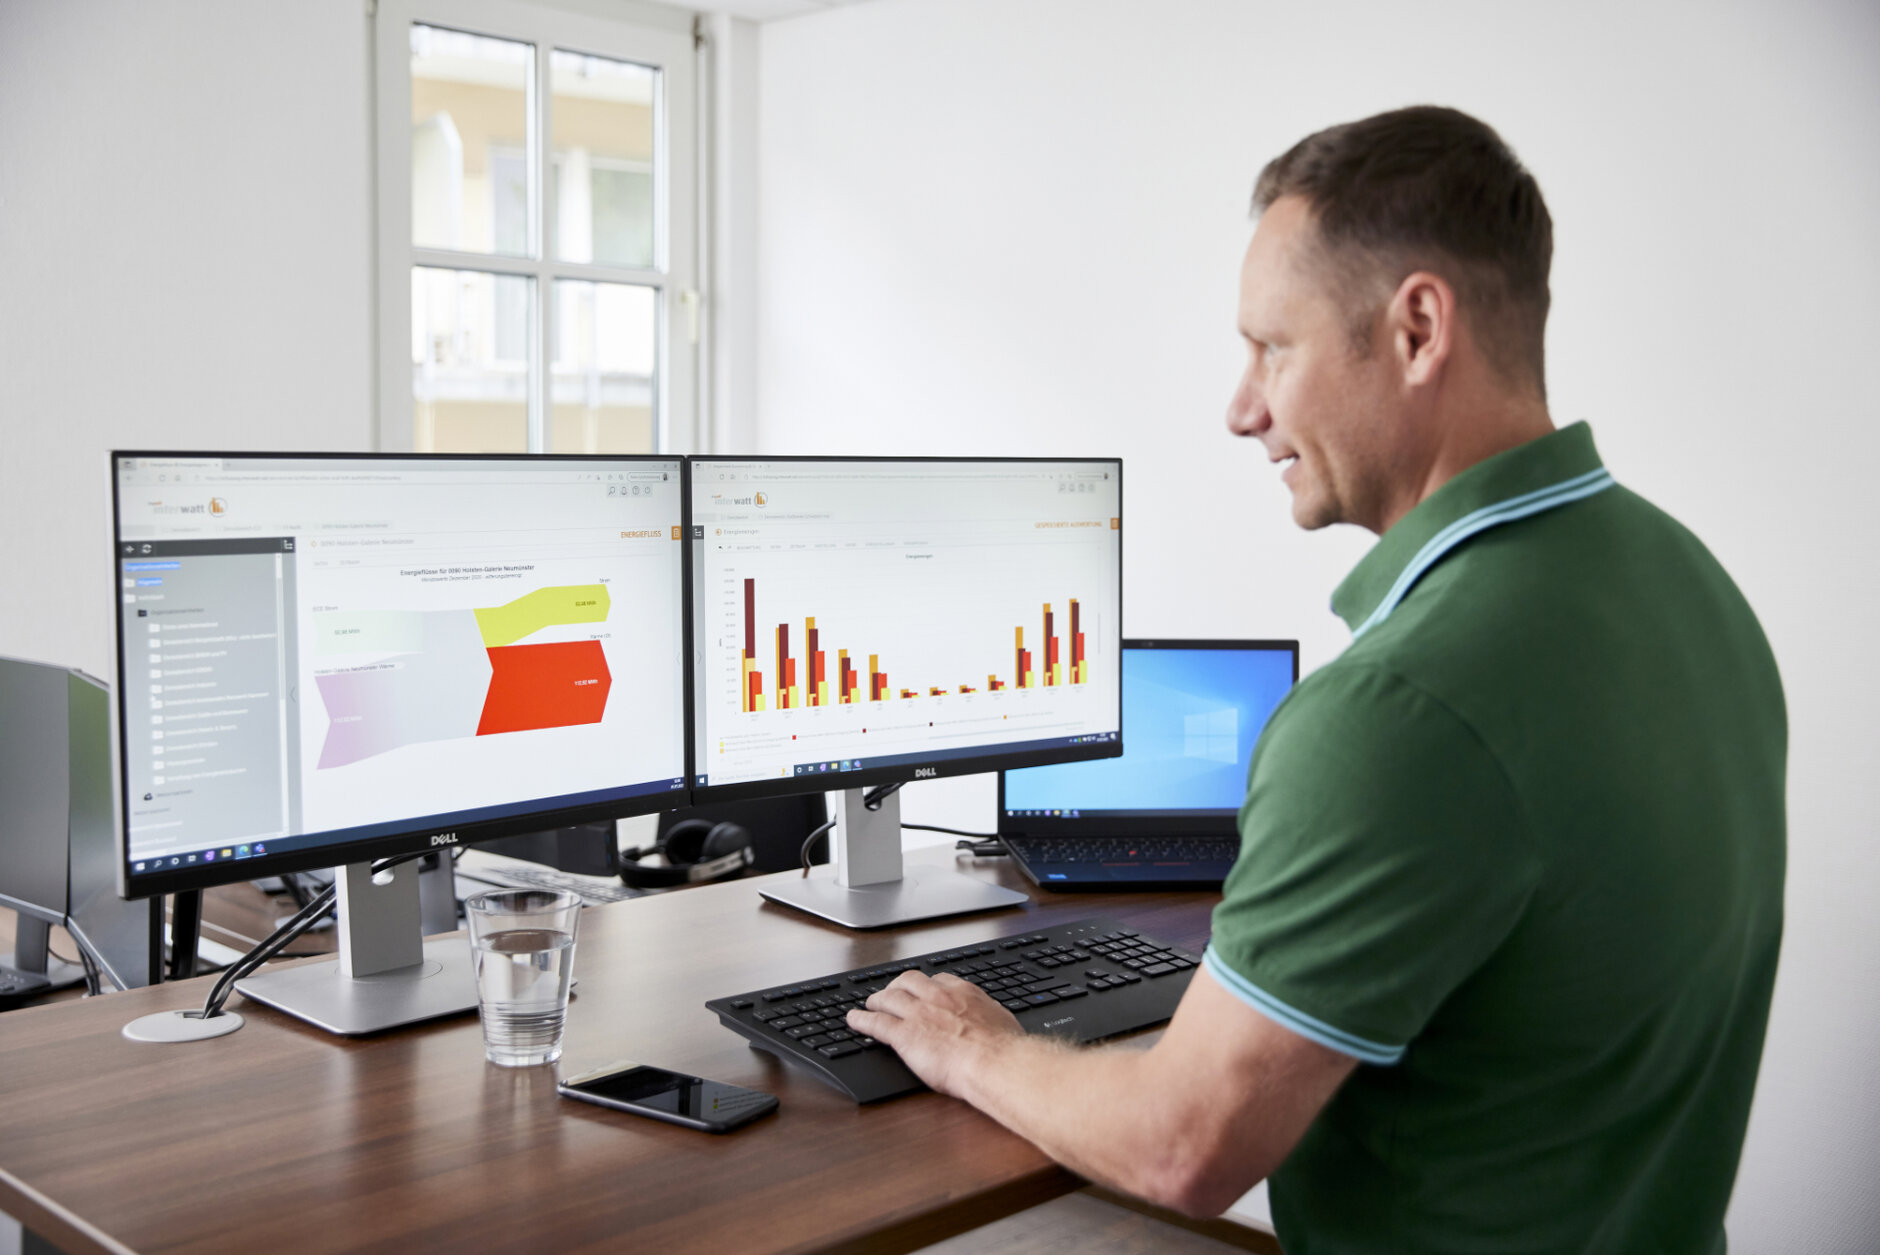
Meaningful analyses are at the heart of energy management: they not only make the actual energy consumption transparent. Potential savings that lead to considerable cost savings can also be identified in this way. They therefore form an important, strategic basis for decisions on measures to increase efficiency and for further investments. With IngSoft InterWatt, you can create analyses according to your needs and taking external influences into account.
Evaluations of energy consumption, other consumption flows, emissions or costs can not only be created quickly and conveniently in the software - complex analyses with several data series and a high level of detail are also possible. Display your recorded data in relation to specific parameters or compare it with key figures and reference values. You can also use IngSoft InterWatt to determine the energy performance indicators (EnPIs) required by DIN EN ISO 50001.
Large selection of analysis options
In order to gain insights from the recorded energy data, the data must be prepared in an appropriate visualisation form (time series, scatter diagrams, etc.). IngSoft InterWatt provides you with various graphical display options with which you can visualise your analyses. These include
- Free analyses provide a quick overview of the consumption of a selected element.
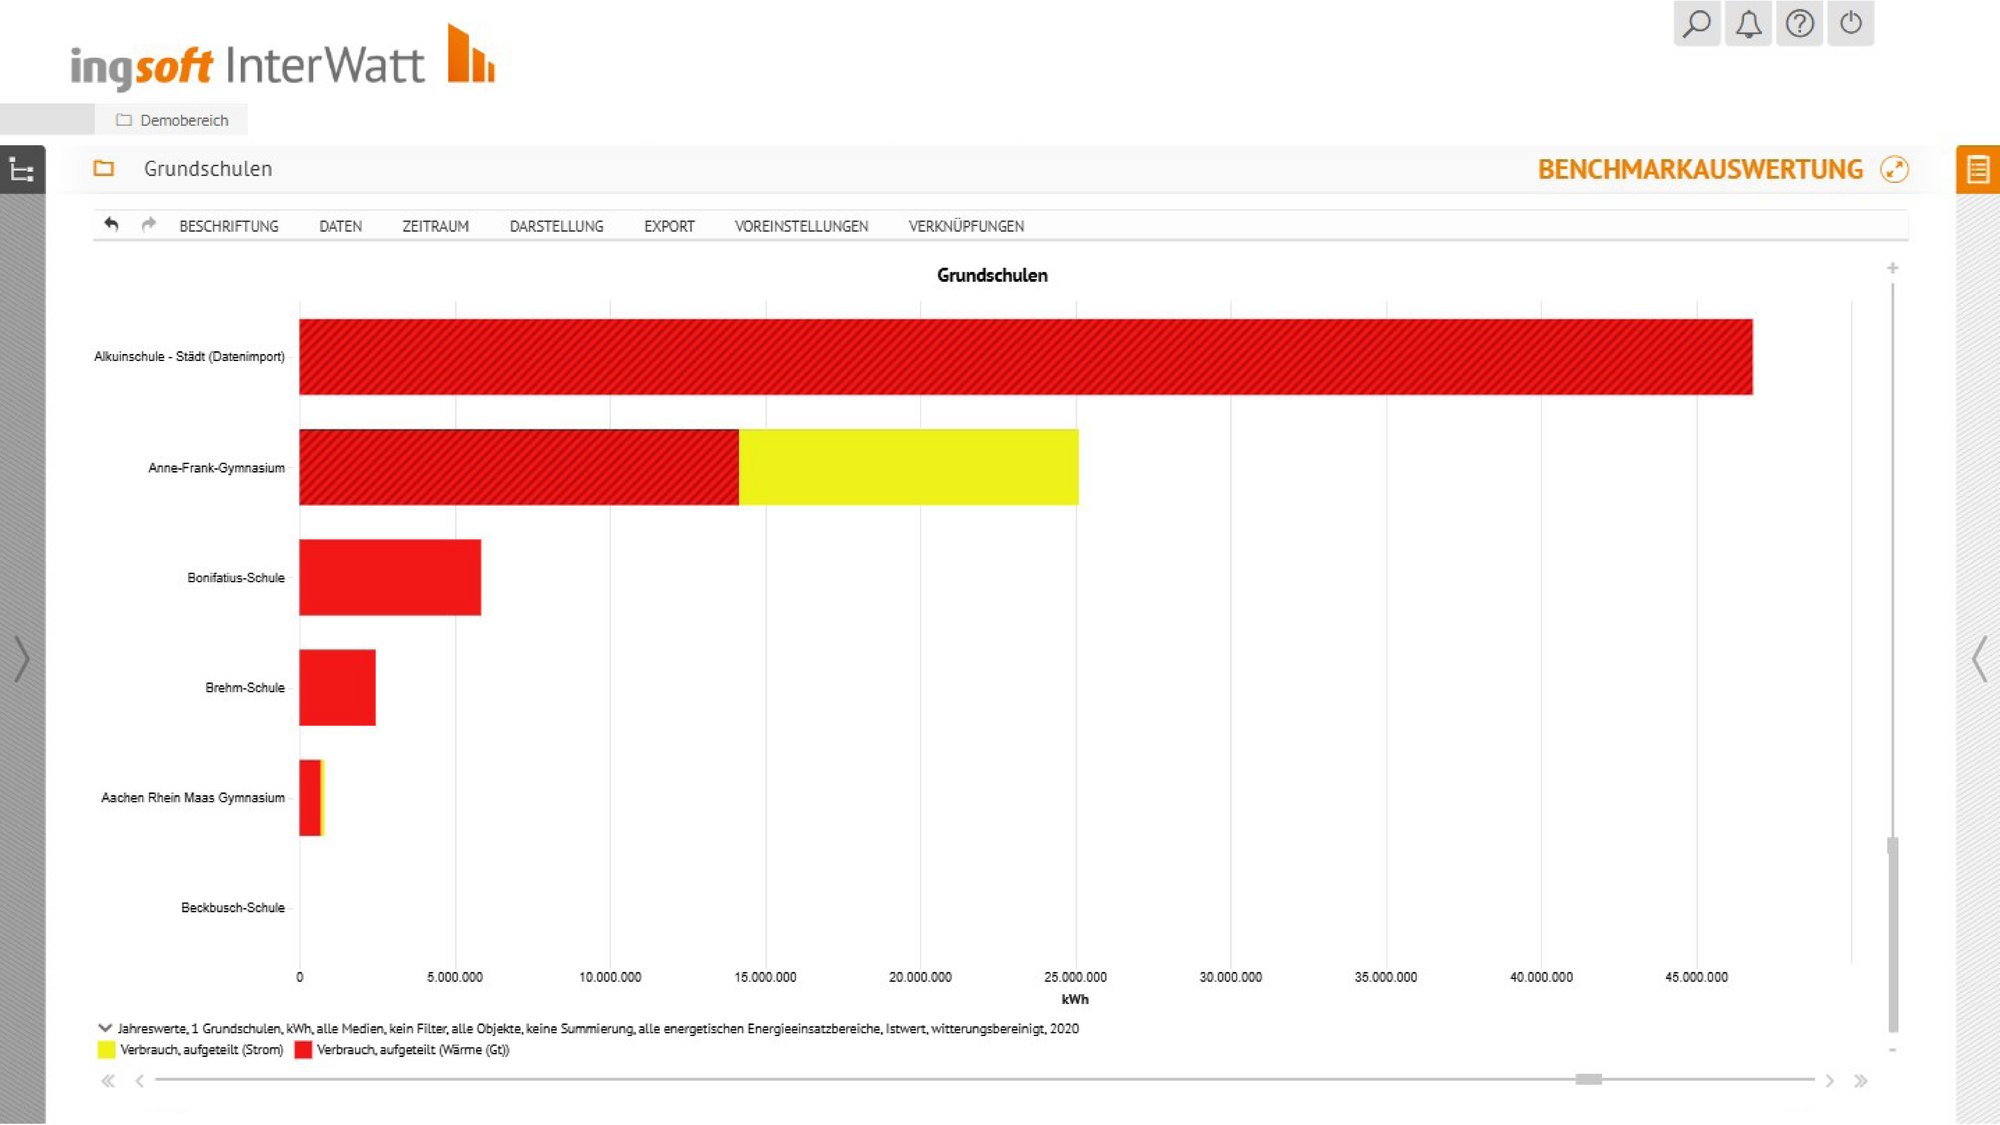
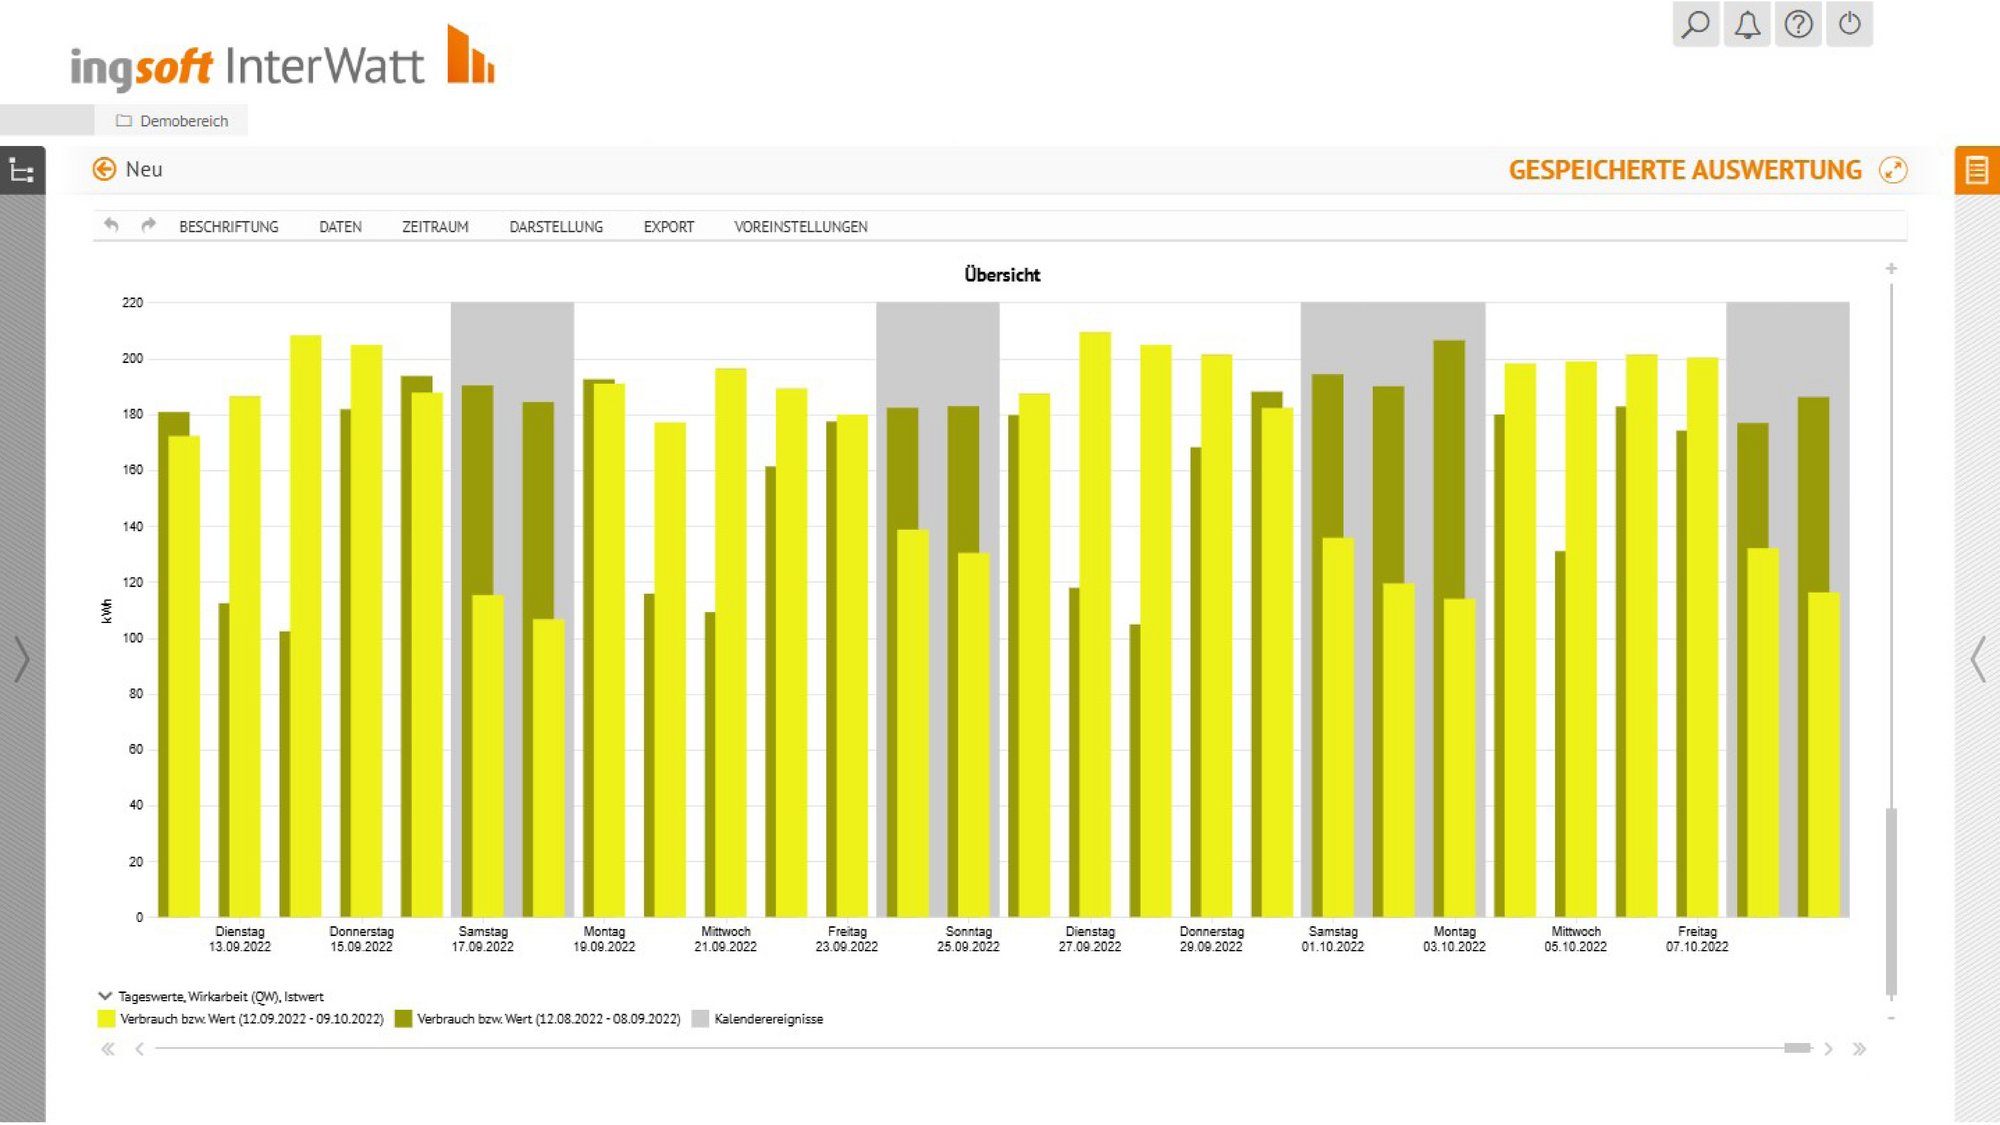
- Benchmark analyses allow you to compare different systems, processes, buildings, etc.
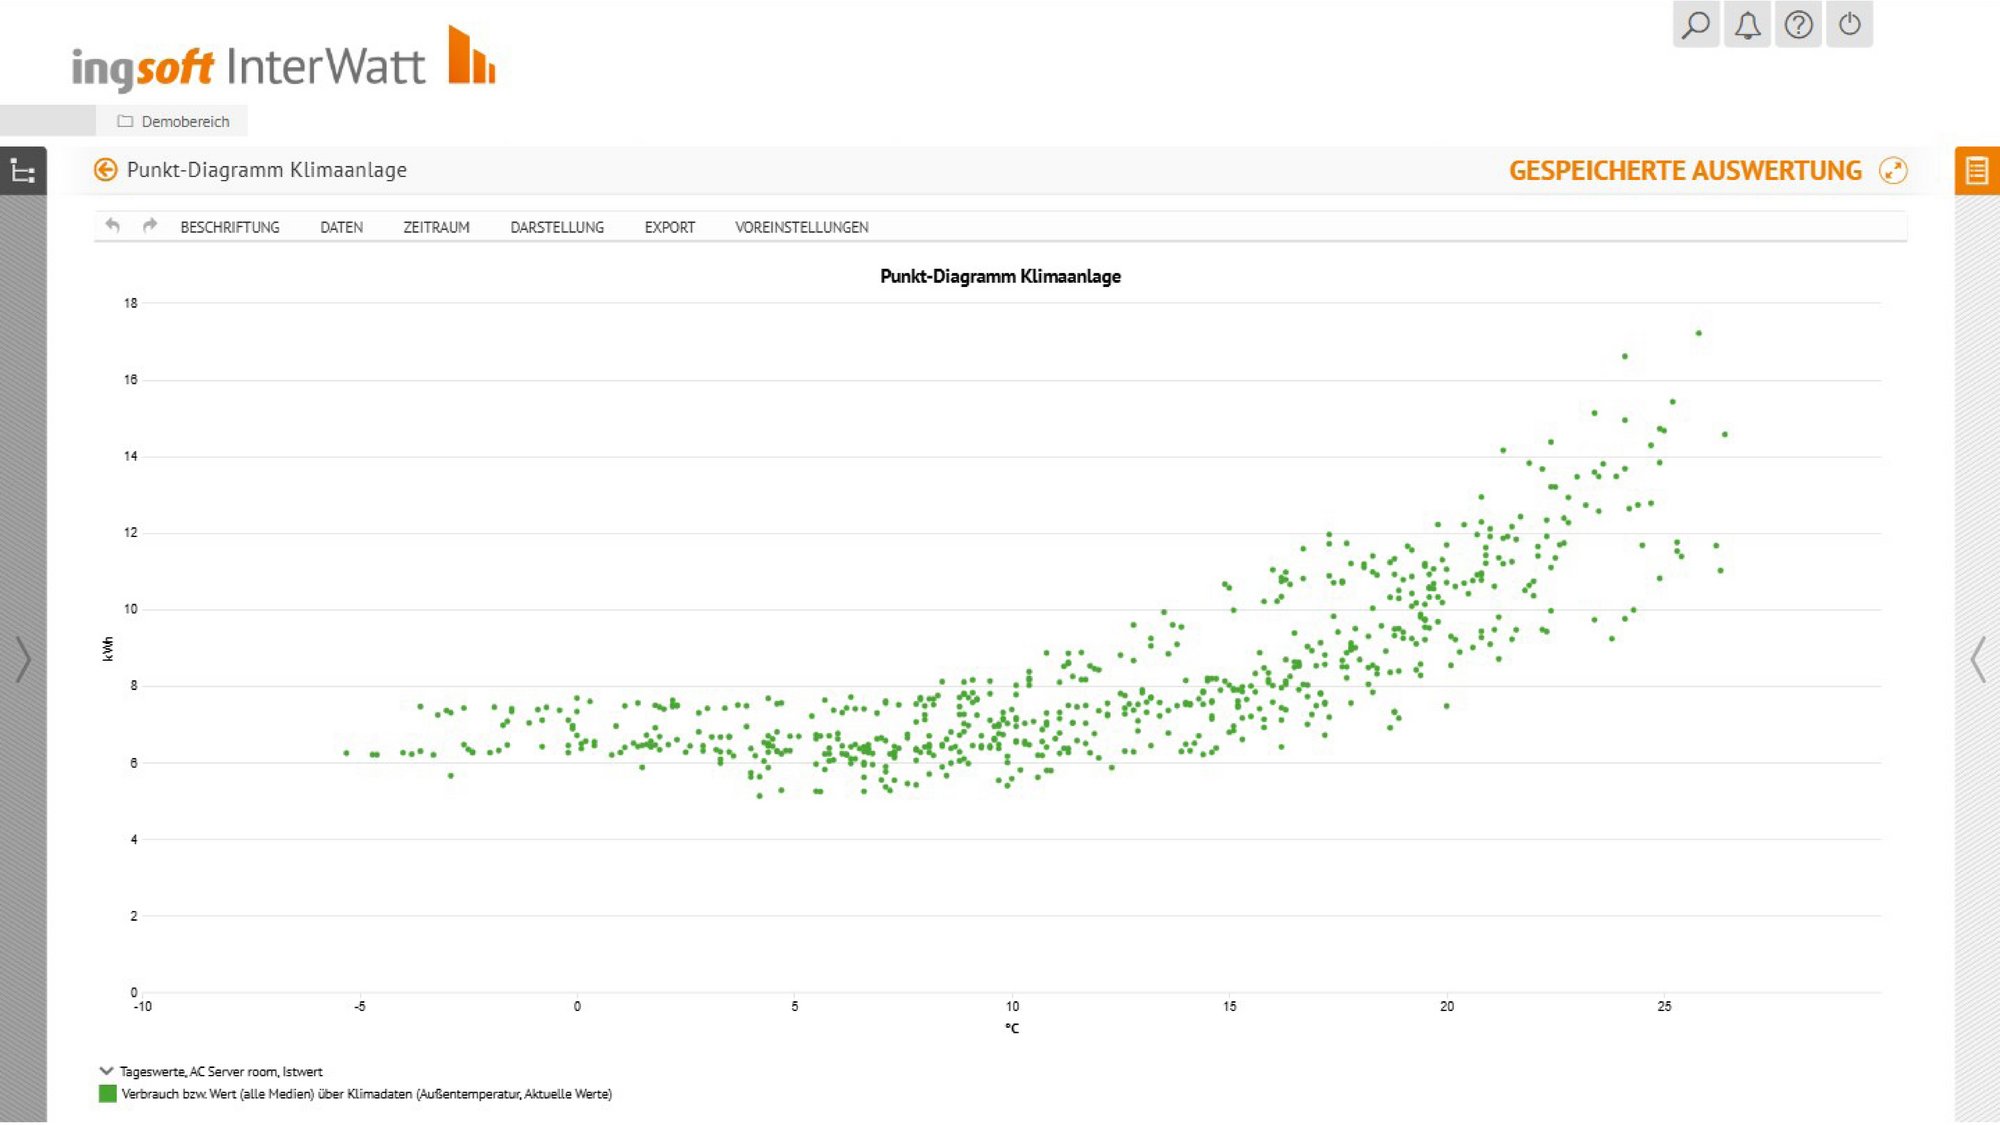
- Point diagram visualises two data series in relation to each other, e.g. at which temperature how much energy is required.
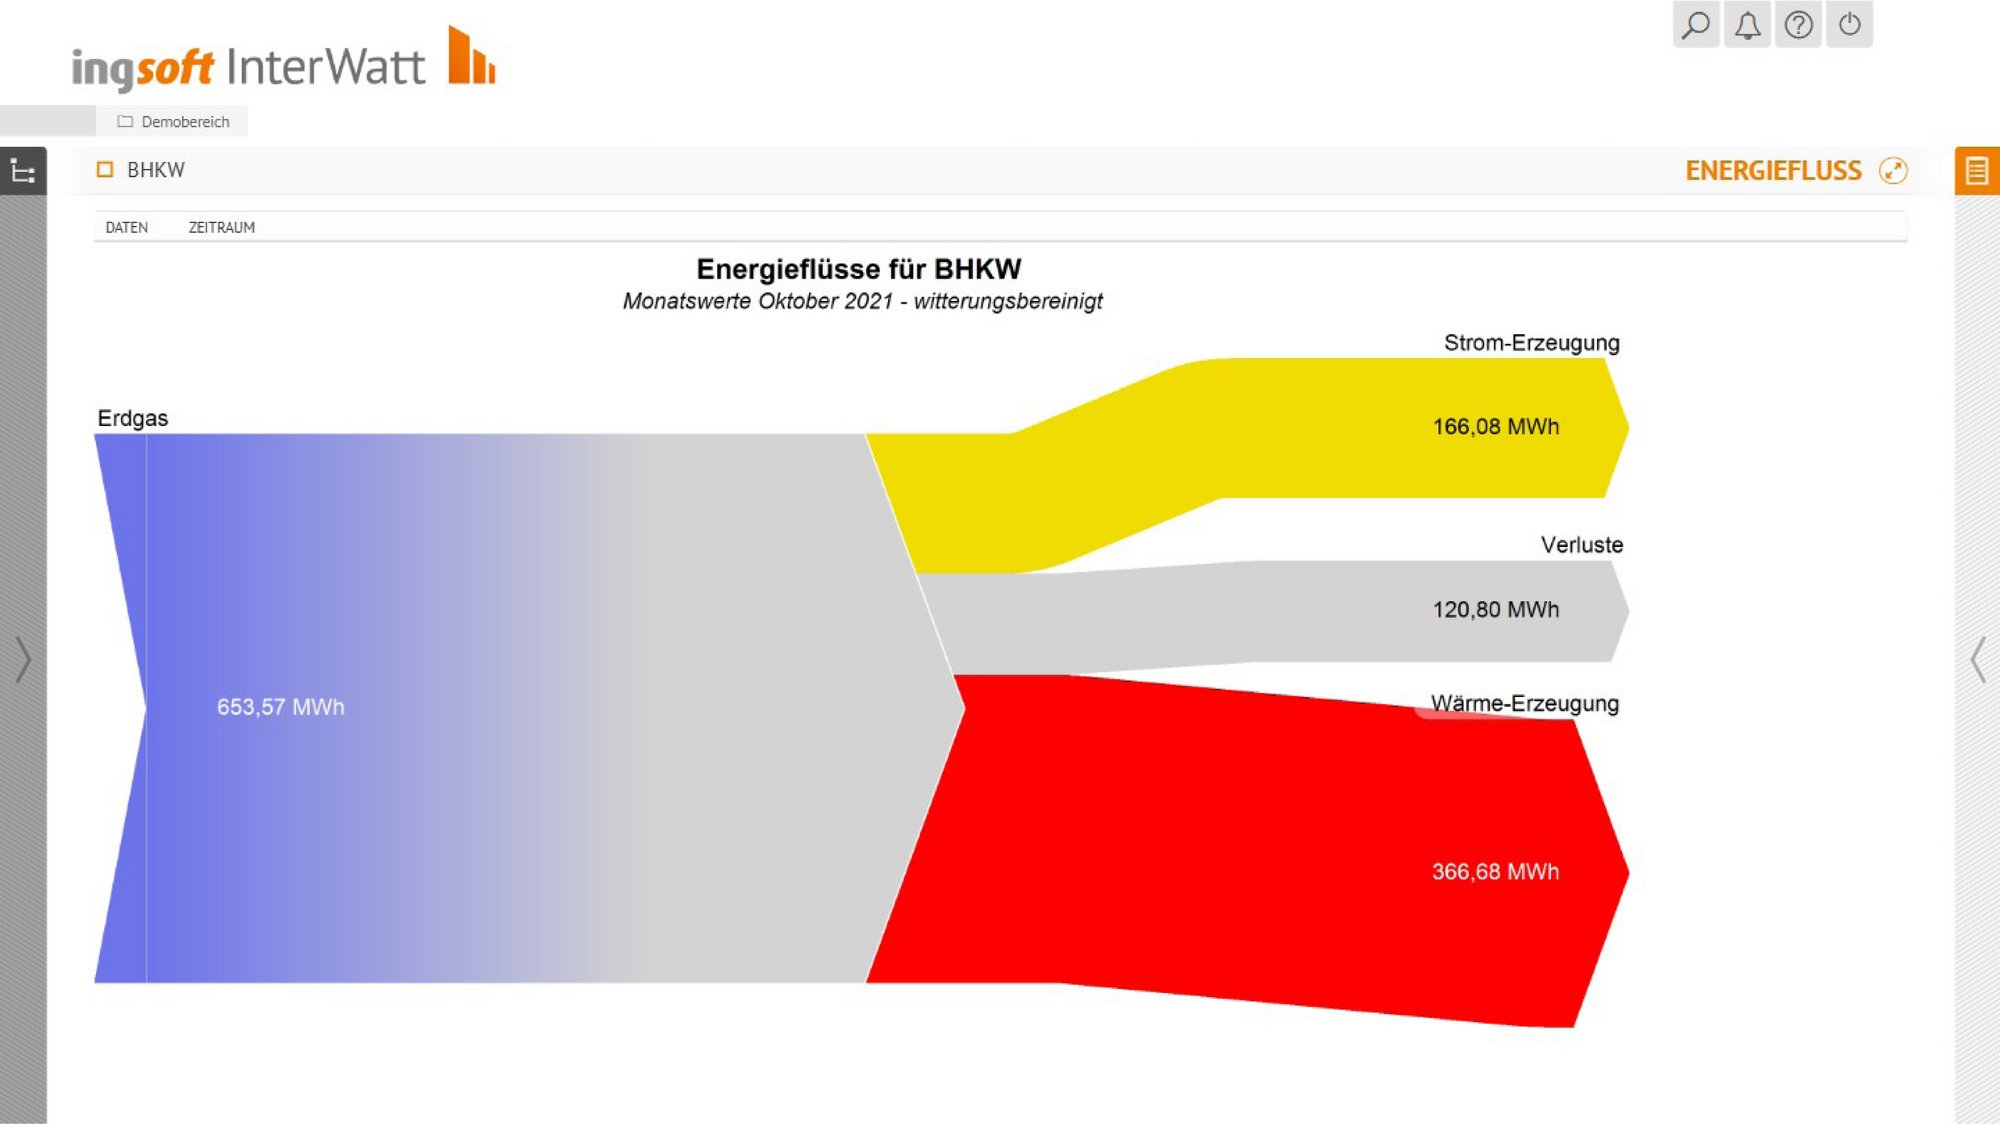
- Energy flow diagram (Sankey diagram) is used to visualise energy flows in the building, i.e. which medium is consumed in which energy area.
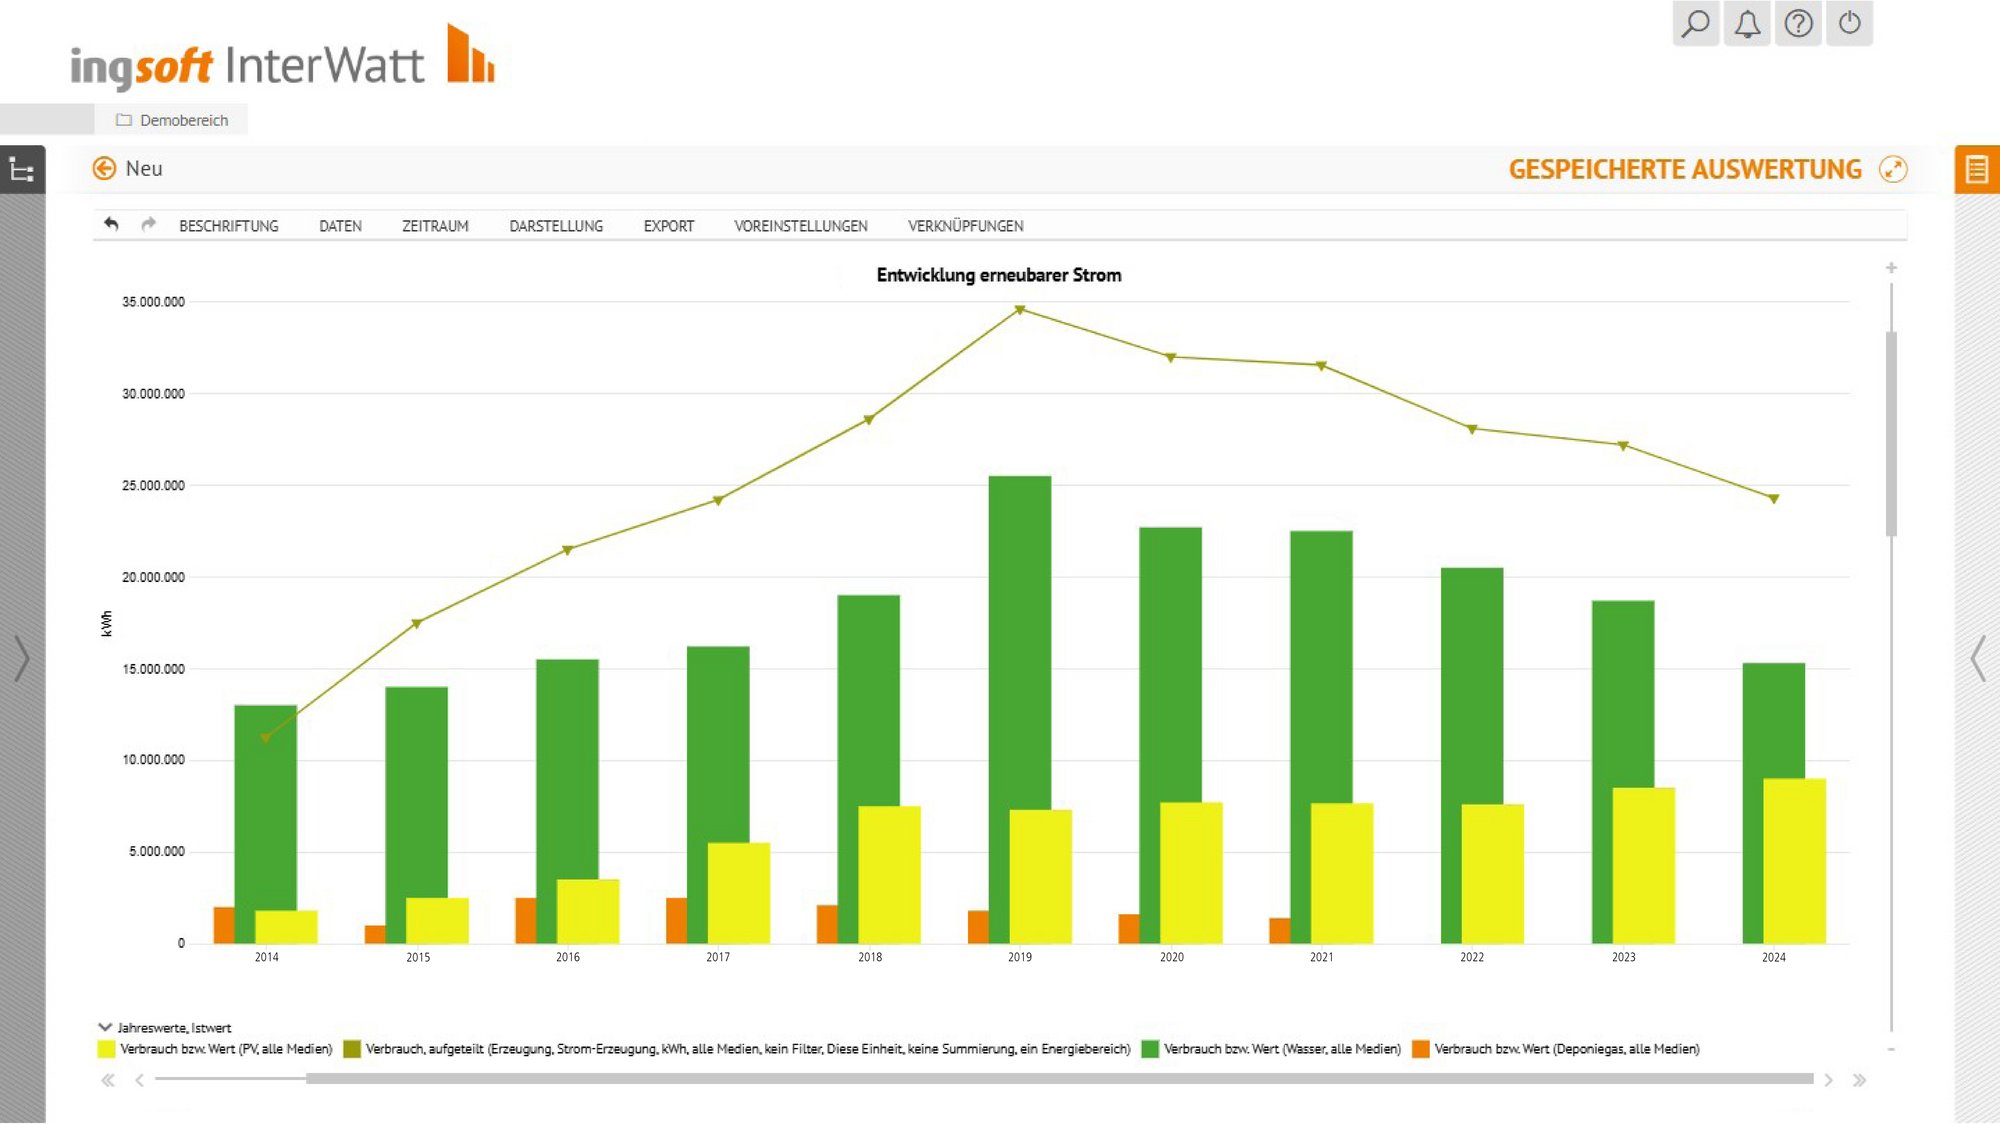
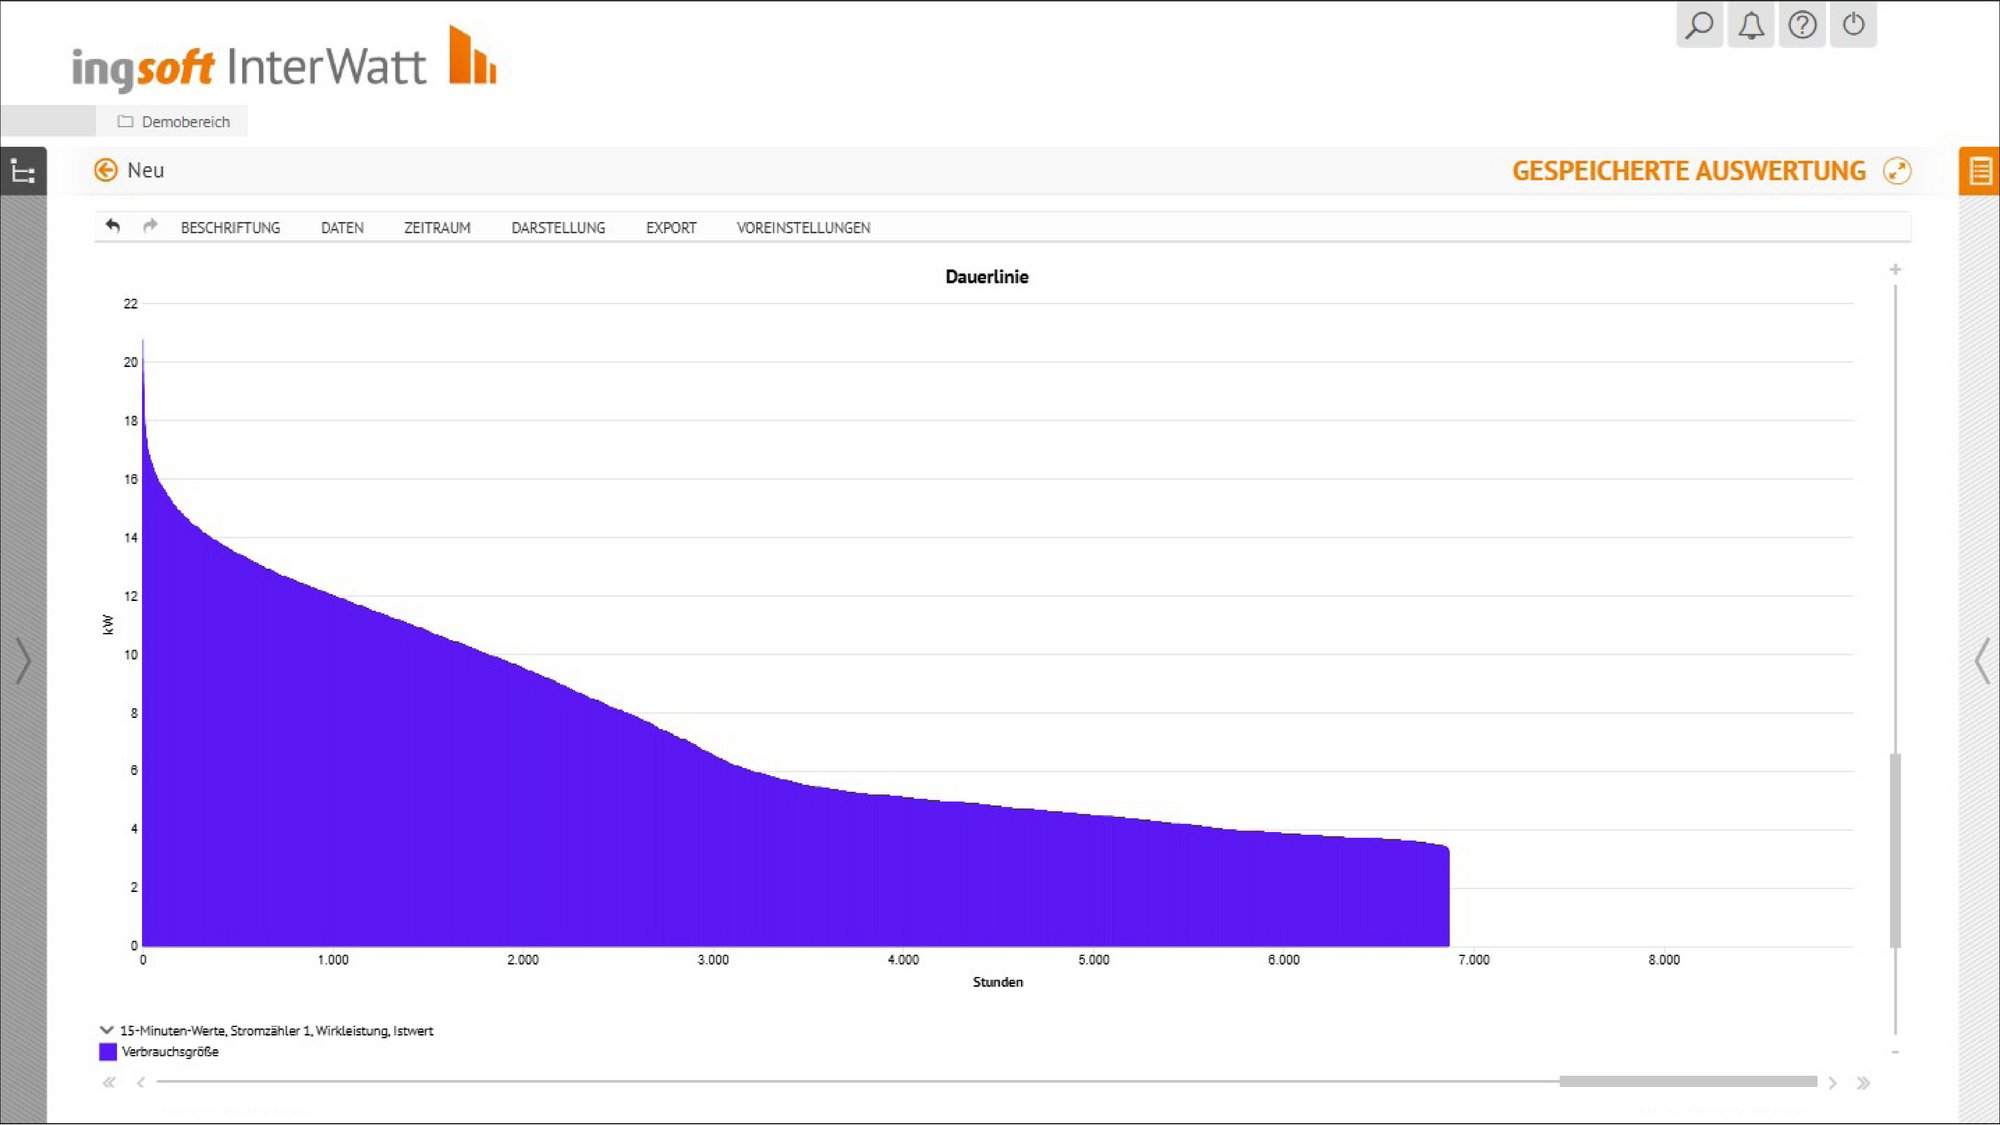
- Annual duration curve visualises how many hours per year a certain power is required.
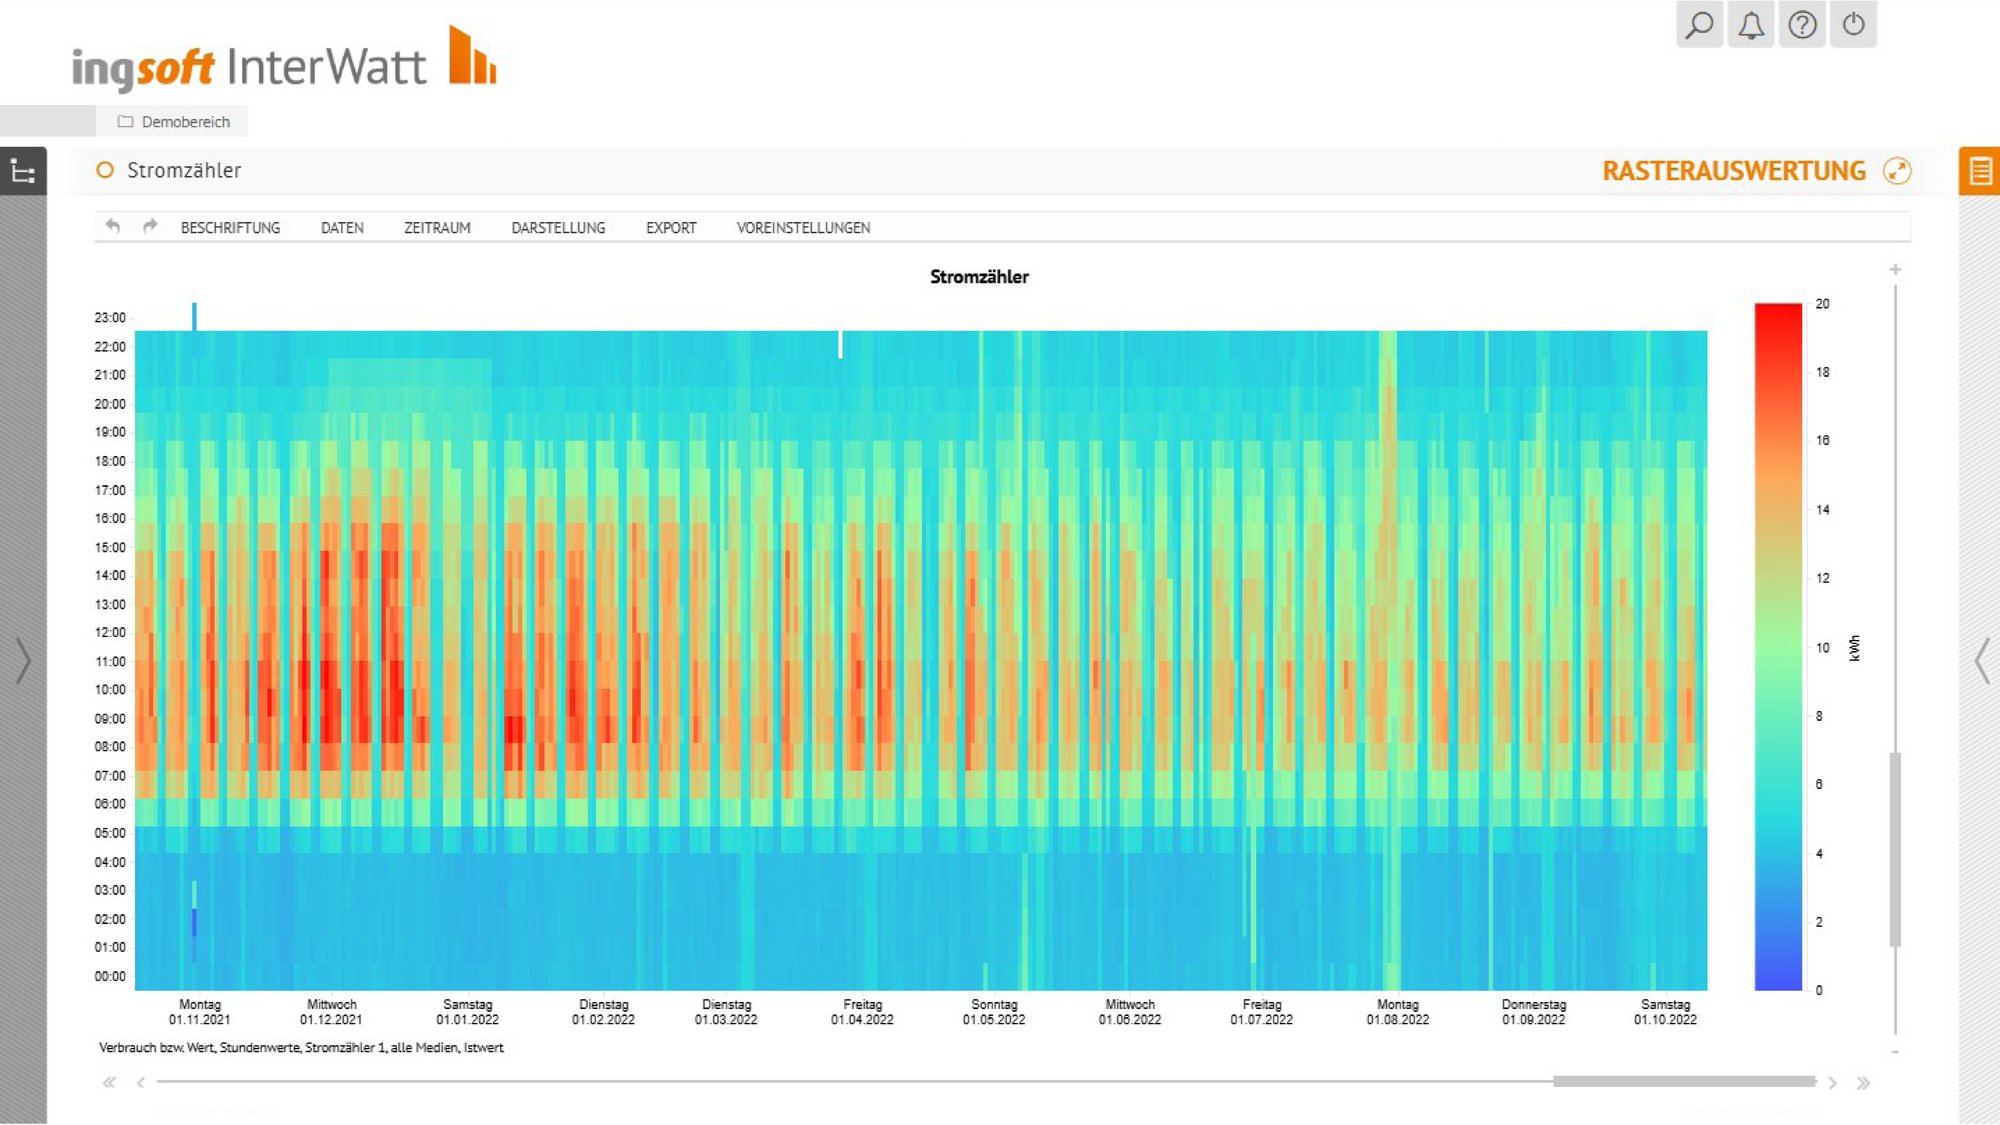
- Grid diagram (CarpetPlot) makes recurring patterns visible and enables analyses.
- Meter reading diagram is used to visualise meter readings.
These features make evaluation easier for you
Evaluation templates
You can configure individual analyses & save them as analysis templates so that you can use them again at any time. Complex analyses do not have to be created each time.
Integration in reports
Integrate the analyses you need or have created individually into your standard or customised reports.
Exports
There are various export options for analyses (CSV, PNG, DocX, PDF, download or e-mail). Export in tabular form is also possible.
Documentation
Comments, measures, work assignments and anomalies can be displayed in the individual analyses.
Weather adjustment
In order to make temperature-dependent consumption values for different periods comparable, the consumption values can be weather-adjusted in the software.
Dynamic period
You can determine the evaluation period according to your requirements. The period is automatically updated according to your specifications, e.g. to display the last 7 days in hours.